Public Status Pages
Real-time monitoring for zero downtime
Deploy transparent, real-time dashboards that automatically reflect your infrastructure's health. StatusPulse handles synthetic monitoring, incident logging, and automated notifications so your engineering team can focus on resolution, not communication.
Configure Your Dashboard View Incident PlaybookFull Visual & Functional Customization
Match your status page to your product's design language without writing a single line of CSS. Adjust color palettes, upload vector logos, and rearrange component layouts to maintain a seamless user experience during service disruptions.
Dynamic Component Grouping
Organize endpoints by environment or service tier. Group API gateways, CDN nodes, and database clusters under clear headers like "North America Production" or "EU-2 Data Center".
Live Metric Widgets
Embed real-time latency graphs, request success rates, and active user counts directly into the public view. Data refreshes every 15 seconds via WebSocket.
Role-Based Access Controls
Assign read-only public views while restricting incident editing to senior SREs. Manage subscriber digests and webhook routing through granular permission sets.
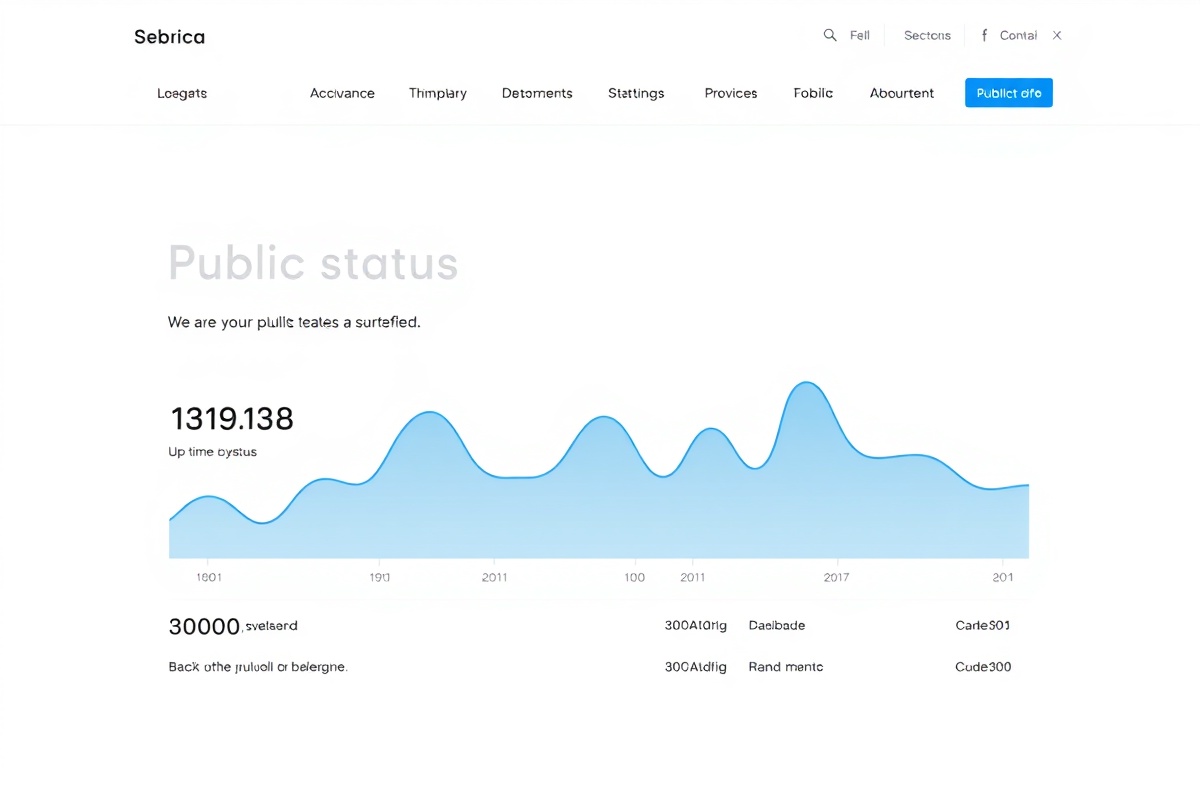
Custom Subdomains & SSL Certificates
Move beyond generic URLs. Deploy your public status page on a dedicated subdomain like status.yourcompany.io or status.internal.app. Every custom domain automatically provisions a valid Let's Encrypt TLS certificate, ensuring secure, trusted connections for your end-users.
Our DNS propagation monitoring verifies record changes in under 60 seconds. Once live, the status page inherits your organization's branding guidelines, including favicon injection, meta tag optimization, and open-graph preview formatting for social sharing.
Claim Your SubdomainAutomated Incident Communication
When infrastructure fails, your customers need clarity, not silence. StatusPulse triggers multi-channel alerts the moment our synthetic monitors detect degradation or complete outages across your endpoints.
Structured Incident Lifecycle
Guide users through Investigating, Identified, Monitoring, and Resolved stages. Automated timestamps and severity tags ensure consistent reporting for compliance audits.
Multi-Channel Notifications
Push instant updates to SMS, email digests, Slack webhooks, and Discord channels. Configure throttling rules to prevent alert fatigue during prolonged maintenance windows.
Post-Mortem Publishing
Attach detailed root-cause analysis documents directly to resolved incidents. Keep a searchable archive of historical downtime to demonstrate continuous improvement to enterprise clients.
Join over 2,400 engineering teams at companies like Finova Systems, CloudBridge Networks, and Meridian Logistics who rely on StatusPulse to maintain 99.99% public trust scores.
Start Communicating Outages Read API Documentation