Features - Comprehensive Infrastructure Monitoring
Real-time monitoring for zero downtime
Start Free Trial View Live DemoUnified Observability Platform
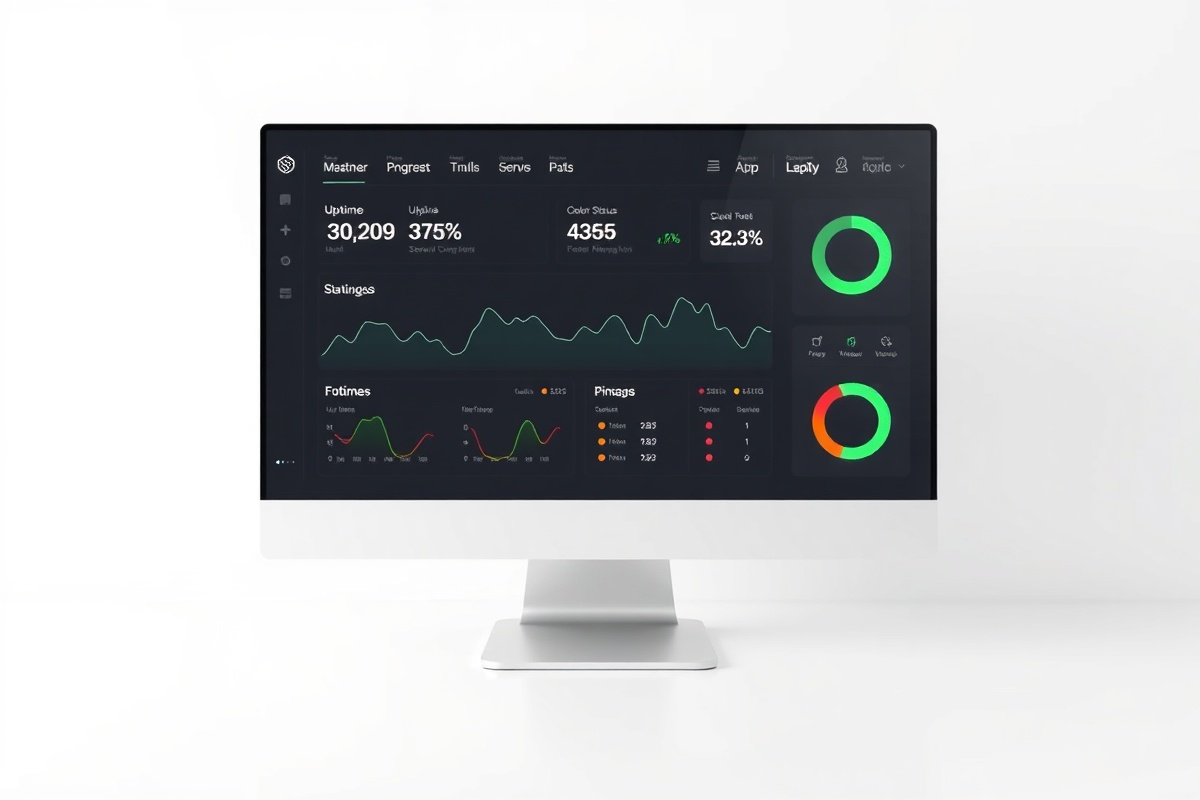
StatusPulse consolidates your entire digital footprint into a single pane of glass. From mission-critical API endpoints to legacy TCP services, we provide enterprise-grade visibility without the infrastructure overhead.
Precision Monitoring Protocols
HTTP/HTTPS Endpoint Checks
Validate response codes, SSL handshake timing, and custom JSON payload assertions. Scheduled every 30 seconds with geographic routing from Frankfurt, Ashburn, and Tokyo nodes.
TCP Port & DNS Resolution
Continuous socket connectivity verification for databases, load balancers, and custom ports. Includes A/AAAA record propagation tracking and MX reputation scoring.
SSL/TLS Certificate Lifecycle
Automated expiration tracking with 30/14/7-day advance warnings. Monitors cipher suite strength, chain validation errors, and OCSP stapling status across all subdomains.
Global Node Coverage & Instant Alerting
Our 42 distributed monitoring probes ensure you detect regional outages before your users report them. When thresholds are breached, StatusPulse routes notifications through your preferred incident management stack.
Slack & Microsoft Teams
Rich embed messages with incident severity, affected endpoints, and one-click acknowledgment links. Supports custom webhook routing and channel-specific escalation policies.
PagerDuty & Opsgenie
Native bi-directional integration for on-call rotation management. Automatically creates incidents with full context payloads and syncs resolution timestamps back to your runbook.
SMS & Voice Calls
Carrier-grade delivery for P1 emergencies. Configurable retry intervals and fallback routing ensures your engineering leads are notified within 60 seconds of service degradation.
Custom Status Pages
Build transparent, branded status dashboards in minutes. StatusPulse provides fully customizable public-facing pages that keep your customers informed during maintenance windows or unexpected incidents.
White-Label Hosting
Deploy on your own subdomain with custom CSS, logo uploads, and favicon configuration. SSL termination is handled automatically via our CDN edge network.
Incident Timeline & Updates
Publish real-time incident logs with severity tags and affected components. Subscribers receive email digests or RSS feeds for every status change.
Performance Analytics & Reporting
Move beyond simple up/down metrics. StatusPulse captures granular performance data to help your engineering team optimize infrastructure and prove SLA compliance to stakeholders.
Uptime & MTTR Tracking
Calculate precise availability percentages down to four decimal places. Automatically log Mean Time to Resolution and correlate downtime events with deployment timestamps.
Geographic Response Maps
Heatmap rendering of TTFB and DNS resolution times across all probe locations. Identify routing bottlenecks and CDN cache misses with historical trend analysis.
Automated SLA Reports
Schedule weekly or monthly PDF exports detailing incident counts, recovery windows, and performance benchmarks. Integrate directly with Jira or Confluence for audit trails.