Uptime Monitoring - HTTP & TCP Checks
Real-time monitoring for zero downtime
Deploy Your First Monitor Read API ReferenceCore Uptime Checking Technology
Infrastructure Reliability
StatusPulse delivers enterprise-grade availability tracking through continuous HTTP, HTTPS, and TCP port verification. Our monitoring engine executes deterministic requests against your endpoints, parsing status codes, certificate validity, and payload keywords to distinguish between transient glitches and critical outages.
Every check runs through isolated, hardened agents that simulate real user traffic without impacting your server load. You get precise failure categorization, automatic retry logic, and instant alert routing to PagerDuty, Slack, or SMS within three seconds of detection.
Sub-30-Second Check Intervals
High-Frequency Probing
Standard uptime tools poll every five minutes, leaving blind spots during rapid failure cascades. StatusPulse supports configurable intervals starting at fifteen seconds for critical production endpoints. This granularity captures micro-outages, deployment rollbacks, and memory exhaustion events before they degrade user experience.
HTTP/HTTPS Validation
Full request lifecycle tracking with customizable headers, authentication tokens, and body assertions. Monitors verify TLS certificate expiration, redirect chains, and exact response payloads against your defined success criteria.
TCP Port Verification
Direct socket connection testing for databases, message queues, and custom APIs. Agents measure handshake completion, verify expected banner strings, and detect port saturation or firewall rule changes instantly.
Multi-Location Testing Infrastructure
Worldwide Probe Network
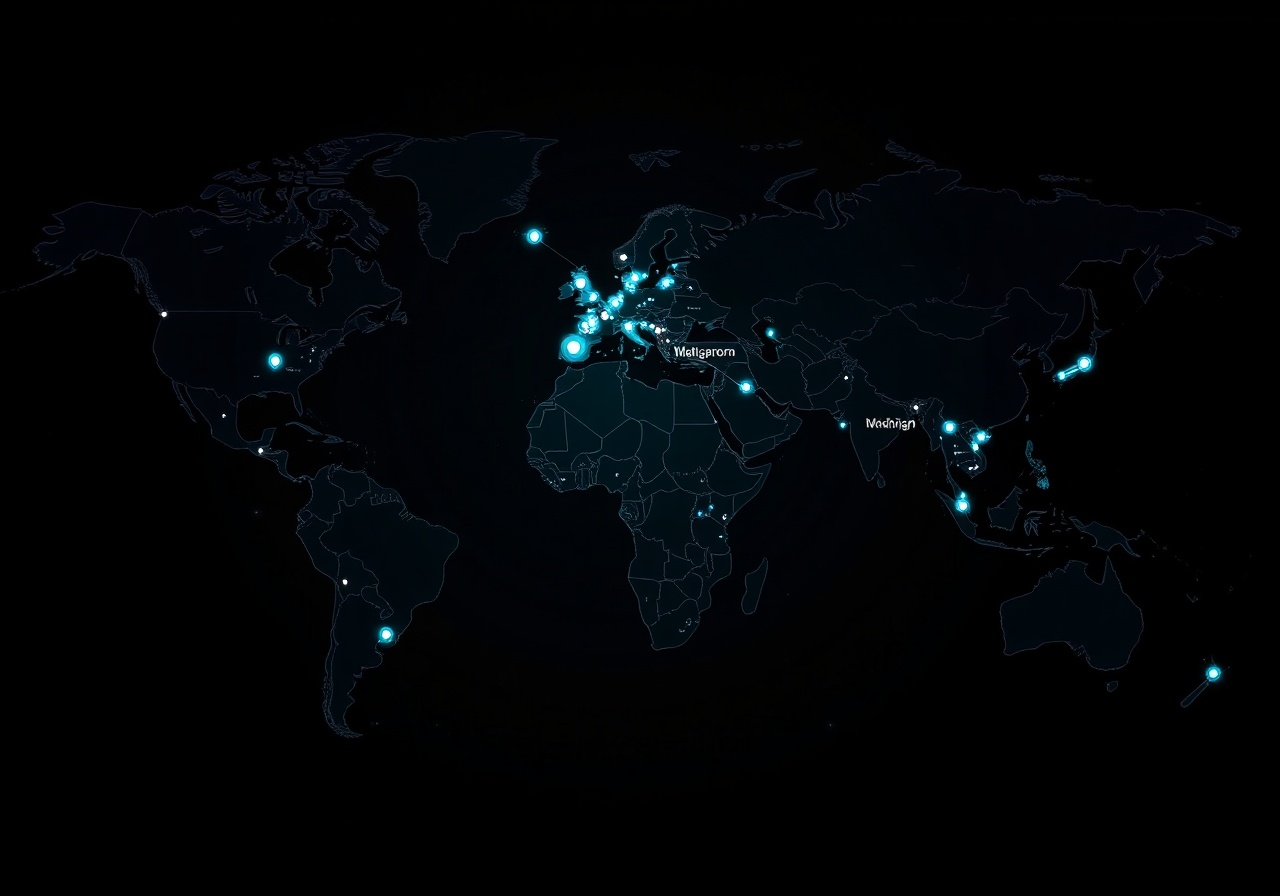
True availability requires geographic diversity. Our distributed agent network spans twenty-three strategic locations across North America, Europe, Asia-Pacific, and South America. Each node independently probes your infrastructure, providing a complete visibility matrix that isolates regional routing failures from global service outages.
When a monitor in Ashburn reports a 502 error while Tokyo and London remain healthy, the dashboard instantly flags a localized CDN misconfiguration rather than triggering a false global incident. This multi-point verification eliminates single-location bias and ensures your SLOs reflect actual customer experience across every market you serve.
Response Time & Latency Tracking
Performance Baselines
Uptime means nothing if your application crawls. StatusPulse decomposes every successful check into granular timing metrics, establishing dynamic performance baselines that adapt to traffic patterns and deployment cycles. You set custom thresholds for acceptable latency, and the system triggers degradation alerts before users notice slowdowns.
DNS Resolution
Tracks authoritative name server lookup times and identifies recursive resolver bottlenecks that add milliseconds to every visitor connection.
TLS Handshake
Measures cryptographic negotiation overhead, flagging misconfigured cipher suites or certificate chain validation delays that stall secure connections.
First Byte Delivery
Captures server processing time and network transit latency separately, giving engineering teams exact visibility into backend query performance versus edge delivery speed.